- metadata:
- source: https://packetpushers.net/network-documentation-series-physical-diagram-2/
---
# Network Documentation Series: Physical Diagram
> ## Excerpt
> How to create proper network documentation? Where to start with your physical diagram? It's all covered here.
---
[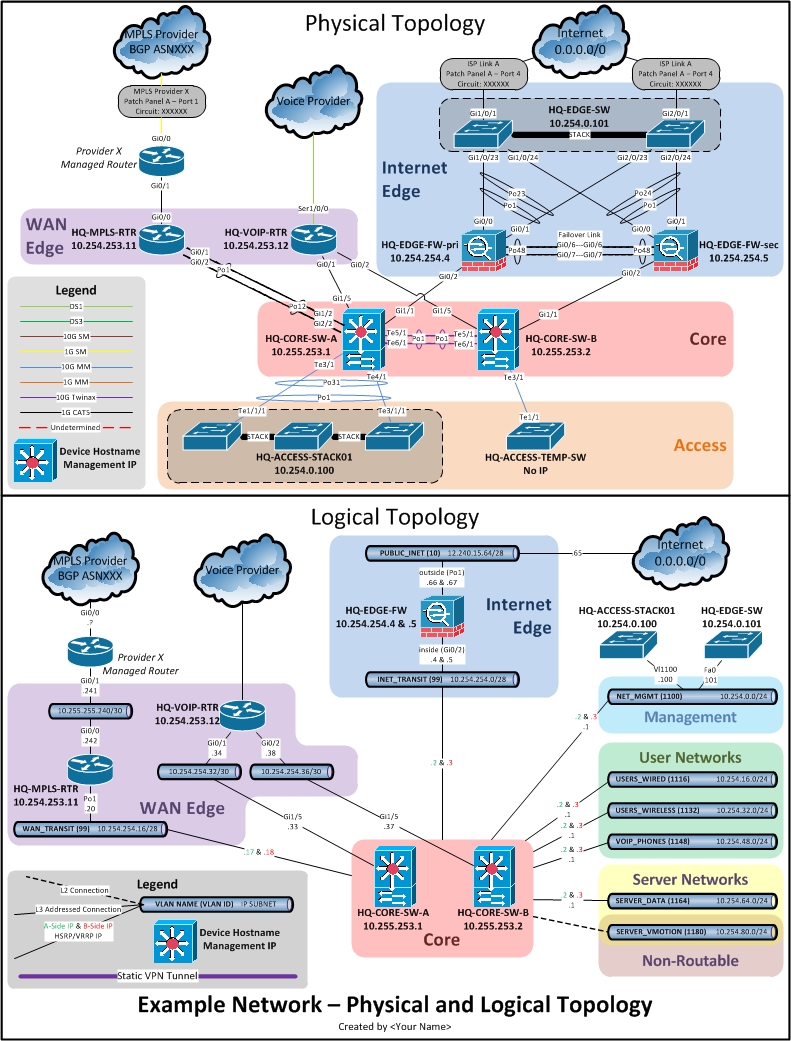](http://blog.packetsar.com/wp-content/uploads/Network-Documentation-Series-Topology-Template-V0.0.0.vsd)This article is a quick tutorial for creating and maintaining a physical network diagram. I prefer to use the term “physical” instead of “L1” because it is more easily understood by somebody unfamiliar with the OSI model. It also removes the assumption (made by many non-technical people) that “L1” and “L3” diagrams are incomplete without a “L2” diagram. So I just call them “Physical” and “Logical” to avoid the confusion.
You can download this article’s template file using the link to the right.
#### Physical Diagram Stencils
While many engineers prefer to use a physical stencil, which is essentially a picture of the actual device (with ports, fans, rack ears…), I prefer to use generic topology icons. I do this for two reasons:
**(1) Informative and Uniform**[](https://packetpushers.net/wp-content/uploads/2015/06/PhysicalStencil-vs-GenericIcon.jpg) – Generic icons tell you the purpose of the device (ie: router, switch, etc), while a physical stencil must be recognized and interpreted by somebody familiar with the look of the specific product and what that product does. The fewer number of required generic icons also brings a uniformity to the diagram.
**(2) Smaller File Size** – Generic icons use much less disk space than physical stencils, and you can use fewer of them, which adds to that effect. All routers can be represented by the same router icon, whereas physical stencils would require a different stencil for each router model. Less disk space makes it easier to share diagrams with colleagues and customers via email (I know, but we all have to do it sometimes…) or whatever file sharing platform you may use.
My favorite resource for generic topology icons is Cisco. You can download a library [here](https://www.cisco.com/web/about/ac50/ac47/PPT_vss.zip) or visit the [Network Topology Icons Homepage](https://www.cisco.com/web/about/ac50/ac47/2.html). I am also including the most common icons in the template linked at the top of the page.
#### Connectors
Connectors are a critical part of a physical diagram. They are used to represent physical cables connecting the different devices. Each end of the connector must be labeled with the port name (as it is named in/on the device) where it terminates. The color of the connector can also be used to represent different types of cables (CAT5, Singlemode, Multimode, DS1, etc…).
**Double/Quad Connector Patterns**
Optimally, you will never have to use more than a single connector between any two devices. This is preferred because of how Visio handles the binding of the connector to the icon and will reroute the connector when the icon is moved.
[](https://packetpushers.net/wp-content/uploads/2015/06/DoubleConnector.jpg)
When using two straight connectors between the same two devices, they will lie directly on top of each other and will look like a single connector. This is where the custom connector patterns (or “Dash Types”) become very useful. The most useful are the Double and Quad patterns. I have created a couple of patterns in the provided template, but you can find instructions on how to build them [here](http://viziblr.com/news/2011/10/4/visio-creating-double-lined-shapes.html).
To change the dash type, right-click a connector, Format>Line, and change the dash type to “Double” or “Quad”. Also make sure to increase the connector weight (to 6 or so) so it becomes wider and the multiple lines are visible.
#### Switch Stacks
[](https://packetpushers.net/wp-content/uploads/2015/06/SwitchStack.jpg)Diagramming switch stacks in a physical network is accomplished in the way shown here. Since a switch stack operates and manages very much like a chassis switch, but physically appears as two separate switches, it makes sense to diagram it as a pseudo-single device using the background box. You can also use this technique to diagram virtual stacking technologies like Cisco’s Virtual Switching System (VSS) or the like. The picture here diagrams a 2-switch stack with a 2-link port-channel between itself and an access switch.
#### Device Labeling
[](https://packetpushers.net/wp-content/uploads/2015/06/DeviceLabeling.jpg)Each node (switch, router, firewall, etc) should optimally be labeled with a hostname, and a management IP address. When possible, list a loopback address that has less dependence on the physical interfaces of the device.
The obvious exceptions to this rule are things like unmanaged or inactive devices, like patch panels, unmanaged switches, or devices managed by somebody else (where the hostname or management IP are unknown). In the case where there is an active device which is managed by somebody else (ie: CPE router), label it with a non-bold, italicized font (labels for standard devices are bold and non-italicized).
#### The Legend
[](https://packetpushers.net/wp-content/uploads/2015/06/TheLegend.jpg)The legend is perhaps the most important part of your diagram. It informs the viewer about the meaning of the objects and connectors in the diagram. It is also used by you to set the ground rules to be followed when creating the diagram; meaning: you visually define the rules of how to read the diagram when creating the legend.
I have included my standard physical diagram legend in the template linked at the top of the page. It has the most commonly used media types defined, but can always be modified as needed. You may also want to cut the number of colors used if you or anybody in your audience has color blindness.
**_\*\*\*NOTE\*\*\*_**
_The most common form of color blindness is Deuteranopia, or Red-Green Color Blindness. To avoid confusion from this form of color blindness, avoid Yellow, Teal, and Violet colors. It is better to use Red and hues of Blue as they will contrast better against each other._
#### Grouping Boxes
[](https://packetpushers.net/wp-content/uploads/2015/06/GroupingBoxes.jpg)One of the first things you may notice on the template document are the colored background grouping boxes labeled “Internet Edge”, “WAN Edge”, “Core”, and “Access”. These boxes are used to group similar devices into a category or named section of the network when they have related purposes. Grouping boxes can be used to take a complex topology, with many devices interconnected in confusing ways, and turn it into a simpler and more hierarchical topology; with each device detailed and defined, but serving a role in the larger function of the group.
Up to this point, this article has described the different components of a physical diagram and their meanings. Next we will cover how to create and maintain a physical network diagram. It is assumed at this point that you will be able to use Visio to diagram the physical network topology, using the methods described above, once you have the connectivity information. This section will describe the steps to take to get that information.
**_\*\*\*NOTE\*\*\*_**
_Remember that a physical network diagram only records the physical (tangible) details of the network. There is no need in this diagram to add details about sub-interfaces, IP addresses, VLANs, etc (other than the IP address and hostname in the device labels)._
#### CDP/LLDP Neighbors
Likely the easiest way to gather information on physical connections is to review a device’s CDP or LLDP neighbor table. This list will tell you about directly connected devices and the interfaces used to connected them. It may also include the remote device hostnames, and possibly even model numbers, capabilities, and management IP addresses.
When starting from scratch on a new diagram and an unknown network, begin at a “core” device used to physically connect many other infrastructure pieces. Look at the CDP and LLDP neighbor tables and insert each device into the drawing one by one. Once complete with all entries in the tables on the core device, log into one of the neighbors and rinse/repeat until you reach the edges of your network.
#### MAC/ARP Tables
After the CDP and LLDP neighbor tables have been exhausted and you have diagrammed all \[infrastructure\] devices from them, you will need to move on to tracking devices down using the MAC and ARP tables. Although CDP and LLDP are common protocols amongst network infrastructure devices, there are always a few which slip by undetected, whether it be because they are security appliances, which typically don’t broadcast or recognize these protocols, or because somebody forgot to enable the protocols. Finding these devices can be tricky, but if they are part of the routing infrastructure, it should be a snap.
**_\*\*\*NOTE\*\*\*_**
_This step is best used in tandem with the building of the logical diagram because it involves checking the routing tables and documenting next-hops. It will be covered thoroughly in the Network Documentation Series: Logical Diagram article, but I will touch on it here as well._
Move back to the core of the network, where you \[assumingly\] have some routing happening. Begin by looking at the routing table and making note of all the next-hop addresses. If you are running a dynamic routing protocol, pull up a list of the dynamic neighbors. If only static routes are used, look at the config for the static routes. Make a list of the next-hop address, being sure to remove all duplicates. Working on a single next-hop IP at a time, check the ARP entry for that next-hop IP. Note the MAC address tied to that ARP entry and check it against the MAC address table to find out which physical port is used for forwarding traffic to that MAC address. Once found, you now have a next-hop IP address mapped to a physical port. Add that device to the diagram (use the router icon and the IP in the label if you’re not sure about the model and function) and move on to the next next-hop IP. Recurse this process until all routing nodes (next-hop devices) are documented.
#### Tracing Cables
Once you have exhausted the first two options, both of which can be done at the comfort of your desk, it’s time to head over to the hot aisle and start tracing those cables. I find it easiest to write notes down onto paper when tracing cables then transcribe those notes onto the diagram when done. Make sure to double-check what you found in the first two steps by tracing the cables to make sure they end up where you think they do.
#### Documentation Tips
Make sure to visit the homepage for this series [Network Documentation Series: Preamble](https://packetpushers.net/network-documentation-series-preamble) and review the generic documentation tips listed there which apply to all network-related documents.